




Gender Pay Gap Report
This report sets out the gender pay gap statistics for Délifrance (UK) Ltd in relation to the reporting year of 2025-26.
Introduction
Under the Equality Act 2010 (Gender Pay Gap Information) Regulations 2017, Délifrance (UK) Ltd is legally required to publish, on an annual basis, specified information relating to our gender pay gap. The data presented relates to the snapshot date of 5th April 2026.
The following information has been calculated in accordance with the Regulations and is legally compliant.
The Gender Pay Gap
The gender pay gap is the difference between the average pay of men and women, expressed as a percentage. The gap is calculated across the entire workforce of an organisation.
The gender pay gap has many contributing factors which will differ from organisation to organisation, across sectors and across geographical locations. These factors may or may not be unlawful or discriminatory, guided by society or cultural aspects, or as a result of internal organisational practices.
It is crucial to our understanding of gender pay disparity to recognise that the gender pay gap is different to equal pay. Equal pay is where there is a discriminatory pay difference between men and women who carry out the same job, jobs rated as equivalent or work of equal value. The existence of a gender pay gap does not automatically give rise to any discrimination or equal pay matters.
The purpose of publishing the gender pay gap is not to confirm compliance with the law; rather it is a way to show the relative equality of jobs being shared amongst men and women in an organisation using pay as a guide to the job’s worth.
Organisational Context
Délifrance is one of the leading bakery players in the UK food industry supplying the major retailers and food service outlets with premium speciality breads and Viennoiserie. Our two manufacturing sites in the UK are in Southall in West London and in Wigston in Leicestershire. In April 2026, we employed 453 people – a slight increase compared with our April 2025 headcount. 66% of our employees are male and 34% are female – so we have seen a 7% increase in the % of women in the business compared to last year.
The overall gender imbalance is because the food manufacturing sector has traditionally attracted more men than women. This is because there are general misconceptions about the hours and shift patterns being unsocial and that factory work is seen as being dirty and physically demanding. Instead, jobs in the Retail and Service sector have been seen as more attractive by women because of more social hours and the working environment. We have found it difficult to attract female candidates to apply for vacancies – to the extent that we have had no female applicants for some factory-based positions (for example, in Engineering or Shift Management).
Our Commitment to Equality and Diversity
We are committed to promoting equality of opportunity for all staff and job applicants. We aim to create a working environment in which everyone can make best use of their skills, free from discrimination or harassment and in which all decisions are based on merit. We do not discriminate against staff based on age, disability, gender reassignment, marital or civil partner status, pregnancy or maternity, race, colour, nationality, ethnic or national origin, religion or belief, sex or sexual orientation.
In 2025-26, we developed a new equity-based approach in our Equal Opportunity Policy that acknowledged that individuals may have different needs and circumstances, requiring tailored resources and opportunities to achieve fair outcomes, rather than simply providing the same resources to everyone (equality). We believe that this approach will enable us to make further progress in addressing the Gender Pay Gap in our business.
We employ people of many different backgrounds and heritages and are proud of our diversity. We promote this throughout the year by celebrating a variety of cultural and religious festivals promoting Diversity and Inclusion. We have introduced some training for all colleagues around the business Leadership Principles and this was completed in July 2026.
Following the introduction of the new Sexual Harassment Policy and training in 2025, we ran an anonymous online Employee Survey in 2025 based on its findings and we have carried out a Sexual Harassment Risk Assessment. We involved all Heads of Department as well as the HR team and our legal advisors to ensure that we identified the risks for colleagues in different parts of our business. The risks identified and the mitigation measures we have put in place were very different in a commercial environment compared to the operational and supply chain world.
We have also introduced some changes to our Family Friendly policies, to make us more attractive to potential employees along with retaining the people who are already within the business – this includes both Maternity/Adoption and Paternity leave that are now paid at a the contractual rate of pay rather than the Statutory Maternity or Statutory Paternity rates. We have also introduced a Menopause Policy aimed at supporting women in the workplace who are experiencing this. In 2026, we will introduce we will introduce software that will help us identify and eliminate any gender stereotyping in our internal and external advertising.
Gender Pay Gap
In the information below, the Mean and Median Hourly Pay and Bonus Gaps between Men and Women are expressed as a percentage difference to the Men’s pay and bonus values. This means that a positive value indicates a gap in favour of Men and a negative value in favour of Women.
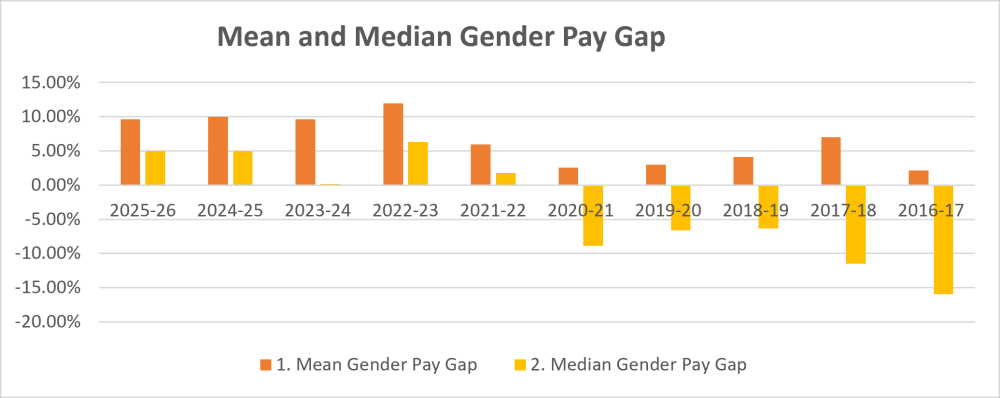
You can see that the statistics on the Median Hourly Pay Gap in the chart below show that women have been earning comparatively more than men for 5 of the past 10 years but that based on the Average Hourly Pay Gap, Men’s pay rates have been consistently higher than Women’s.
Mean Gender Pay Gap
Based on the mean (average) hourly rate of pay for Male and Female employees in the relevant pay period, our Mean Gender Pay Gap is 9.2%*.
This shows that Men earn on average 9.2% more than Women or £1.76 an hour more. In 2024/5, the gap was 10% and so this is an improvement of 0.8% on the previous year and is 2.8% better than in 2022-23.
Median Gender Pay Gap
We believe that the Median is probably a more accurate measure of the Gender Pay Gap because it neutralizes the extreme ends of the data. Based on the median (middle) hourly rate of pay for male and female employees in the relevant pay period, our Median Gender Pay Gap is 5.2%* with men receiving £0.84 an hour more than women using this measure. This is 0.2% more than in 2024-5. Comparing this with the National Median Gender Pay Gap measured by the Office for National Statistics in April 2025 of 12.8%, we are 7.6% better.
Bonus Proportions
In 2024, we introduced a Loyalty Bonus Scheme and ran this again in 2025. It paid out in February 2026 for all colleagues not covered by the Management Bonus Scheme. The level of payout linked to the EBITDA performance of the Company and individual attendance and disciplinary measures. This meant that we saw more colleagues qualifying for a Bonus than in previous years. The following table shows the proportions of Male and Female employees who were paid a bonus during the relevant period compared to the last 4 years:
|
2025-26 Male % |
2025-26 Female % |
2024-25 Male % |
2024-25 Female % |
2023-24 Male % |
2023-24 Female % |
2022-23 Male % |
2022-23 Female % |
|
82.5% |
84.5% |
86.4% |
84.4% |
73% |
57% |
29% |
54% |
Please note that the % refers to the proportion of male employees who received a Bonus and the proportion of female employees who received one and not the relative % of male to female employees.
As you can see, there has been a 3.9% decrease in the number of men receiving a Bonus compared to last year and a 0.1% increase in the number of women compared with last year. Looking back to 2023-24, the number of men receiving a Bonus has increased by 9.5% and the number of women by 27.5%. Clearly, this is a big improvement in the overall % of colleagues receiving a Bonus and an even bigger % increase in the number of women getting one.
The payment of the Loyalty Bonus is dependant on individuals’ attendance and disciplinary record. The 2% difference in the number of men and women receiving a Bonus is explained by the fact that men in Délifrance UK and I tend to have a worse disciplinary and attendance record than their female colleagues.
Gender Bonus Gap
Mean Gender Bonus Gap
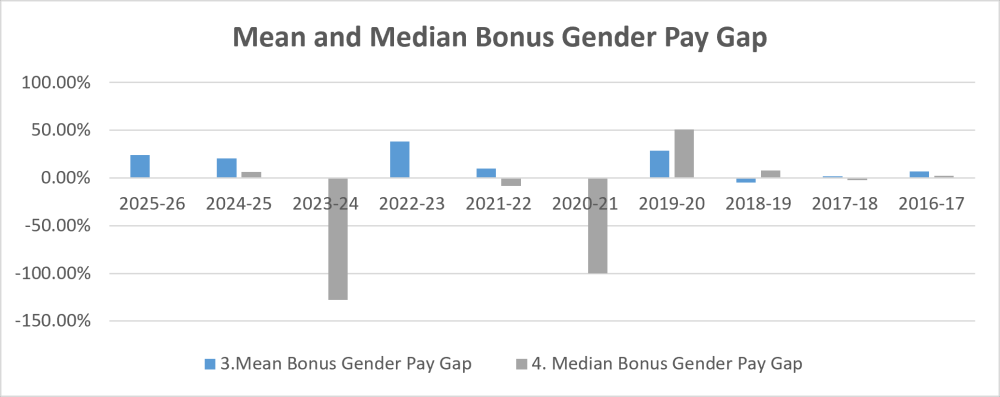
Based on the Mean (average) Bonus Pay for male and female employees in the relevant pay period, our Mean Gender Bonus Gap is now 24.2%* in favour of men. This is a slight increase from last year which was 20.3% in favour of men. This is despite running a Loyalty Bonus Scheme that was based on a fixed amount for all – rather than being linked to a % of salary. The Management Bonus Scheme is based on a % of Salary and there are more men in this scheme than women and it is likely to have skewed this result.
Median Gender Bonus Gap
Based on the Median (middle) Bonus Pay for Male and Female employees in the relevant pay period, our Median Gender Bonus Gap in 2024-25 was 128% in favour of Women. This year it was 0% i.e. we achieved parity at £1,000 for both Men and Women. This is a great result.
*Rounded to one decimal place
The chart below tracks the 2 measures over the past 9 years.
Quartile Pay Bands
The following chart summarises the proportions of relevant male and female full-time employees in the Lower, Lower-middle, Upper-middle and Upper quartile pay bands looking at this year and the year before:
|
Quartile |
This Year Male % |
Last Year Male % |
This Year Female % |
Last Year Female % |
% Female Difference |
|
Lower |
69% |
57% |
31% |
43% |
-12% |
|
Lower-middle |
41% |
70% |
59% |
30% |
+29% |
|
Upper-middle |
76% |
72% |
24% |
28% |
-4% |
|
Upper |
70% |
70% |
30% |
30% |
0% |
The number of Women in the Upper Quartile positions has remained the same compared to last year. However, the number in Upper Middle and Lower Middle paid positions have seen movement with the Lower Middle increasing by 29%.
This is because we were focussed on trying to address the relatively low number of women at this level in the organisation when we were recruiting externally. By contrast, the number of Women in the Lower Quartile paid jobs has decreased by 12%.
Comment
· Our Median Gender Pay Gap of 5.2% compares favourably with the National Gender Pay Gap Median of 12.8% as published by the Office for National Statistics (ONS) for April 2025.
· We are delighted to have closed the Median Gender Bonus Gap in 2025-2026. We believe this is because of the positive impact of the Loyalty Bonus Scheme on the Gender Bonus Pay Gap. We will continue to run this Scheme in 2026-27.
· We believe that by continuing to promote the Equality and Diversity and Inclusion agenda across the UK business, we will continue to reduce the Median Gender Pay Gap and sustain our progress in the Median Gender Bonus Gap.
· The breakdown at each pay band level broadly reflects the overall Gender Profile in our business of 65% Men and 35% Women. The proportion of Women in each pay band suggests we are getting better at recruiting Women into positions in junior and middle management roles.
· We look forward to increasing the number of women in the workforce as a whole and to promoting a culture in which career progression is available for all.
· We continue to be committed to 40% of the Délifrance UK and I Board Members being female and we have achieved this target for the past 6 years.
· We are focused on seeing an improvement in our Gender Pay Gap metrics in the coming years.
Niall Cogan
General Manager, Délifrance (UK) Ltd